Welcome to
Forster Ranch
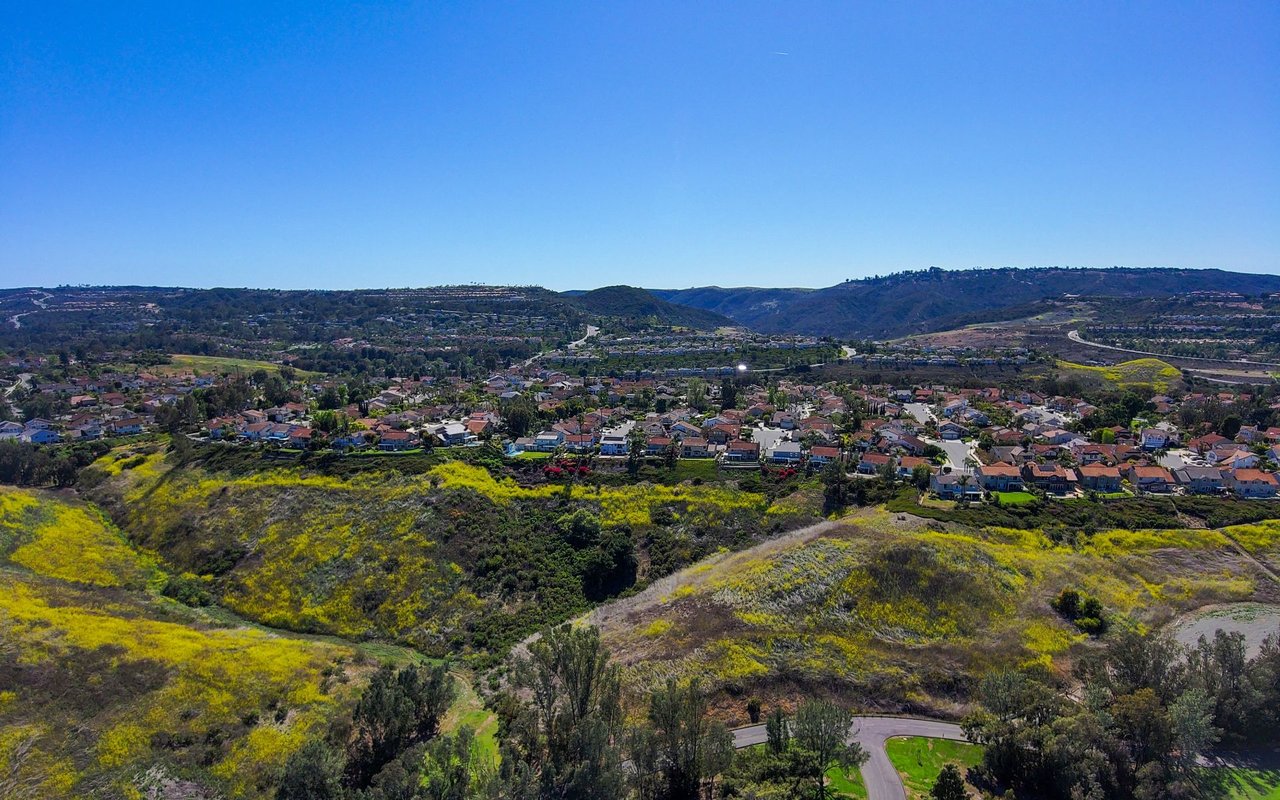
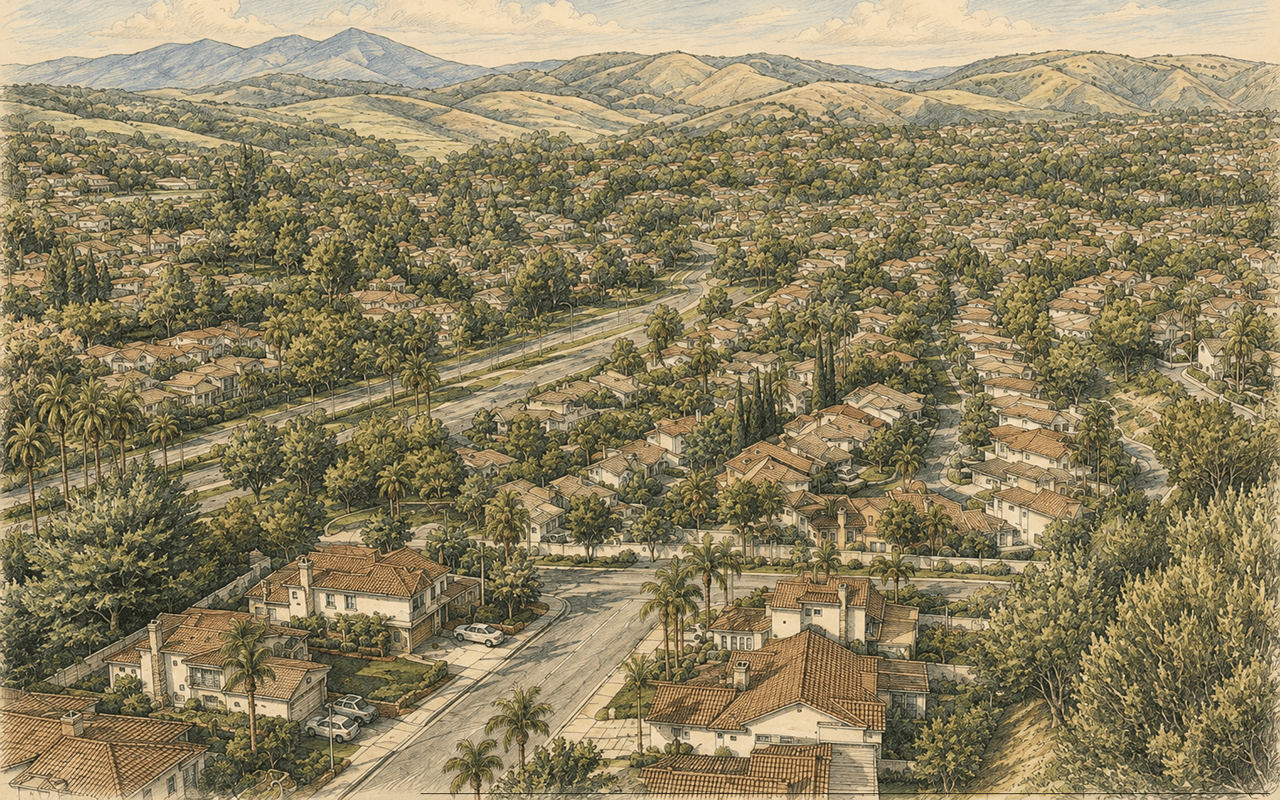
Scenic hiking trails and open spaces like the Forster Ridgeline Trail define this active Forster Ranch area.
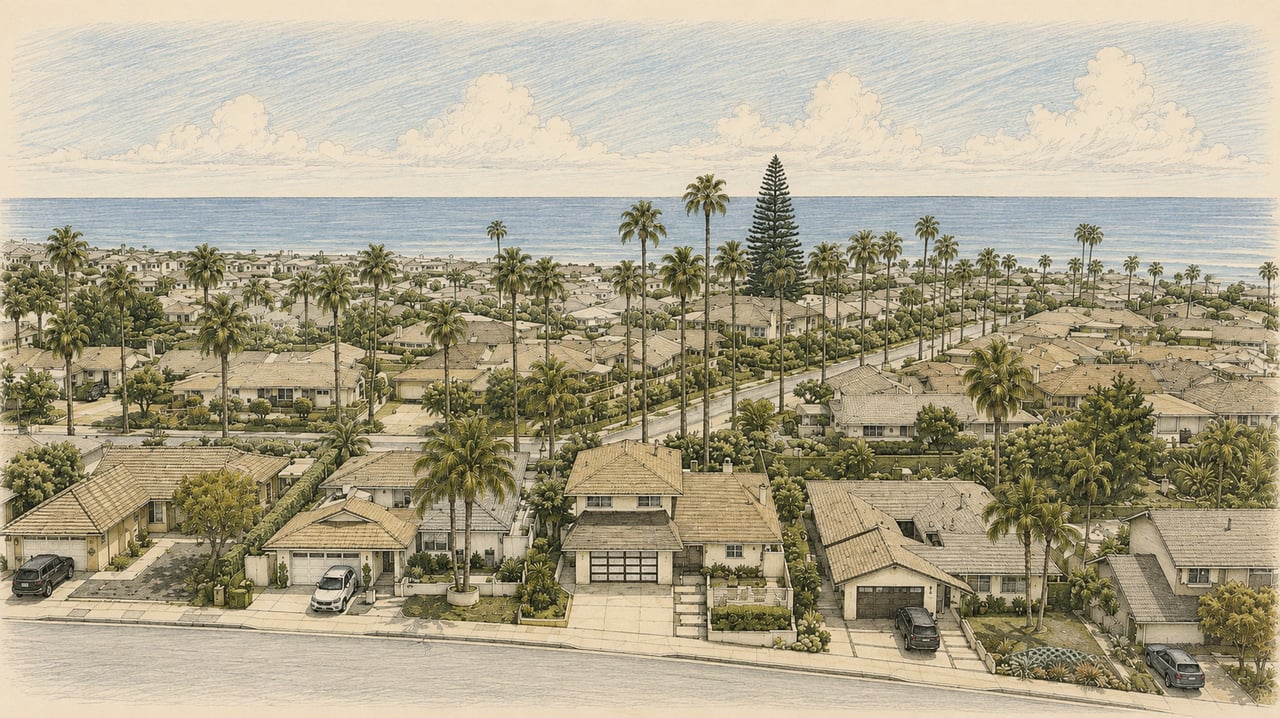
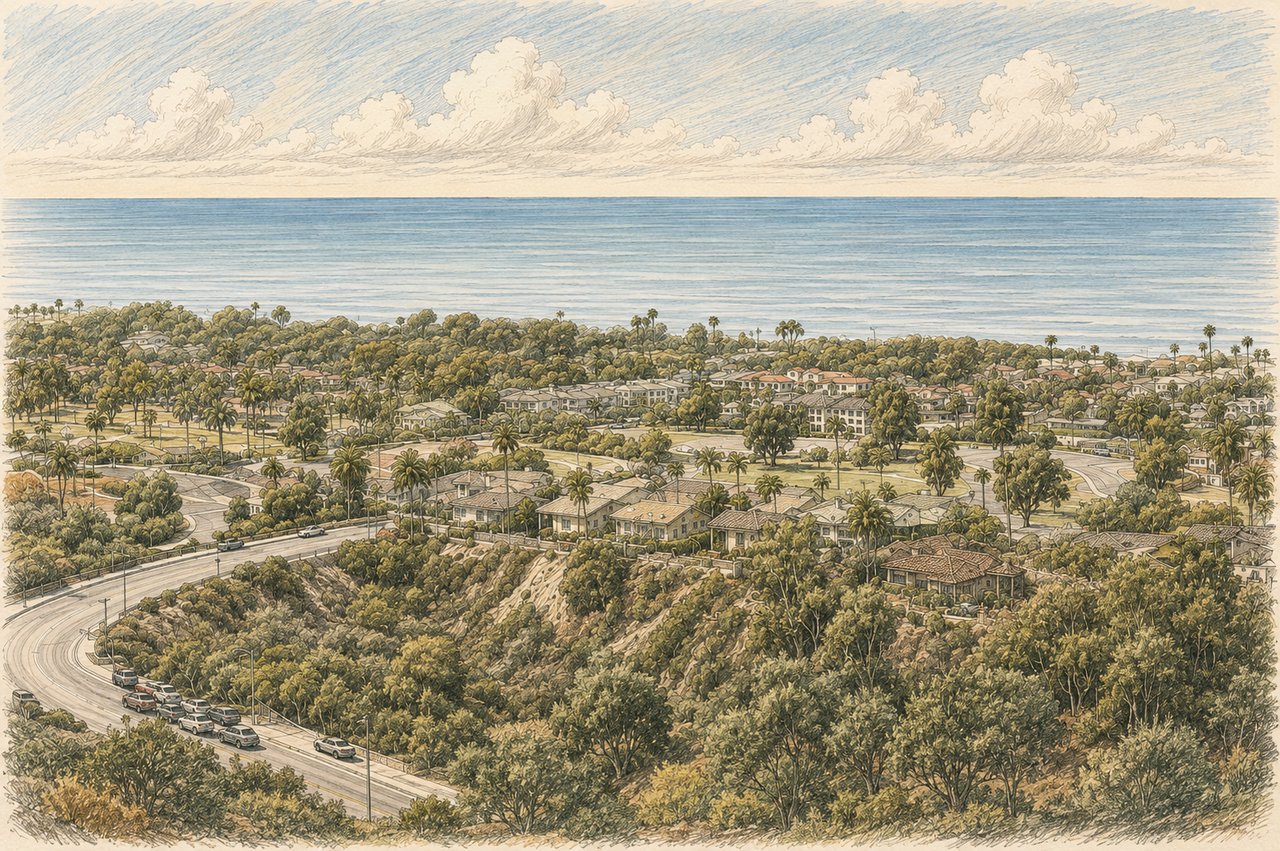
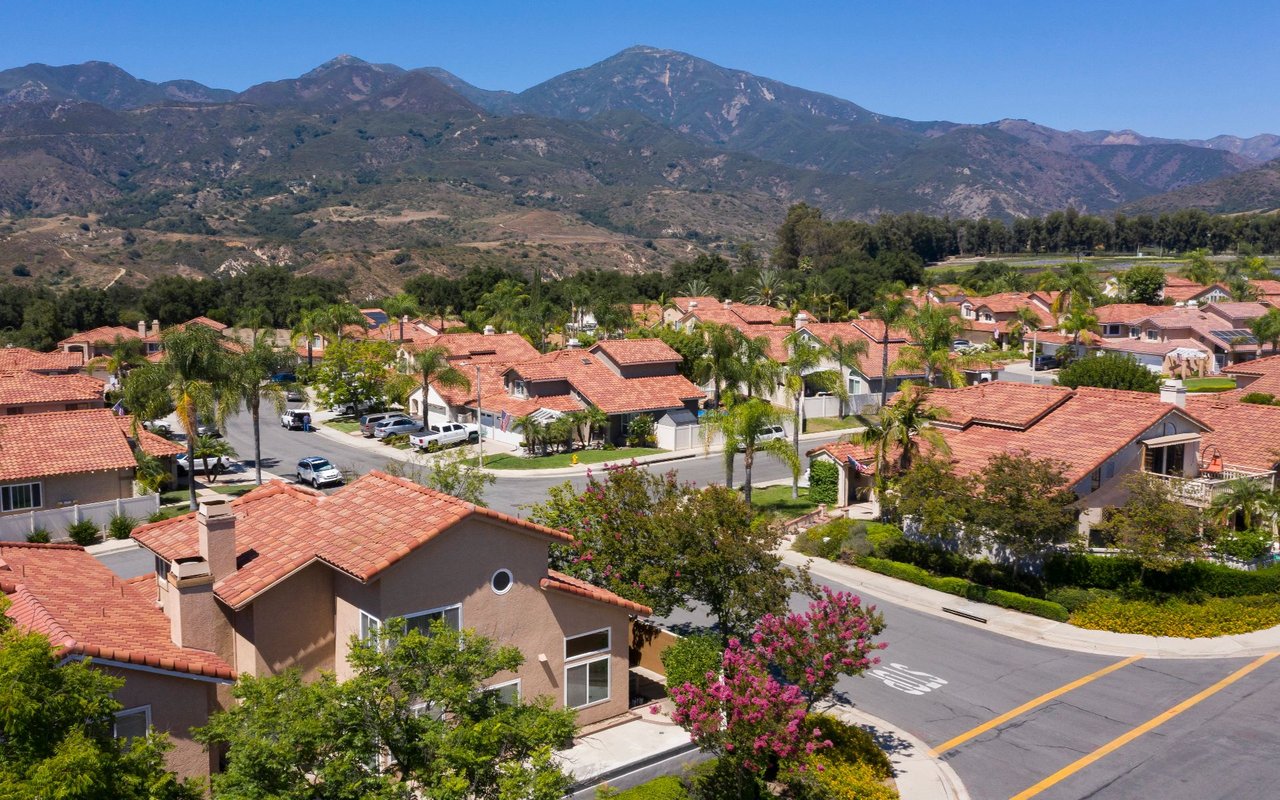
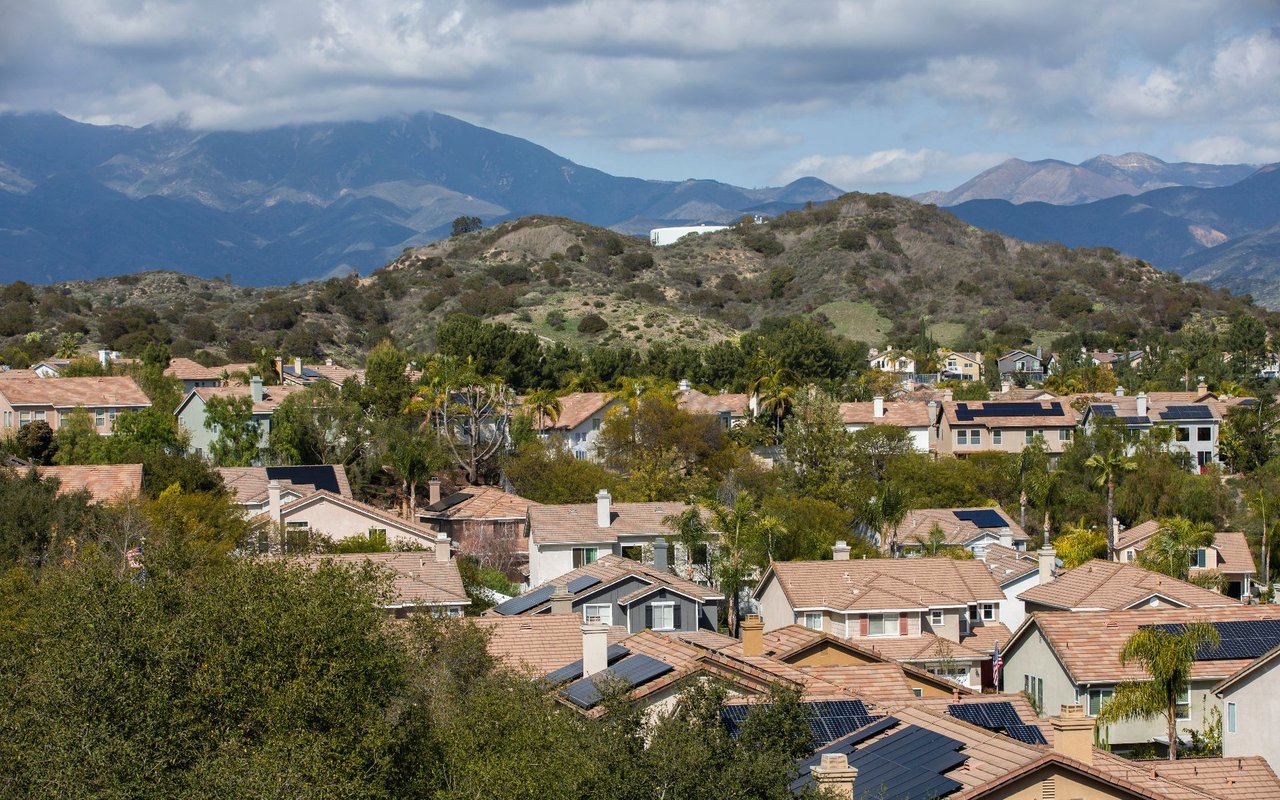
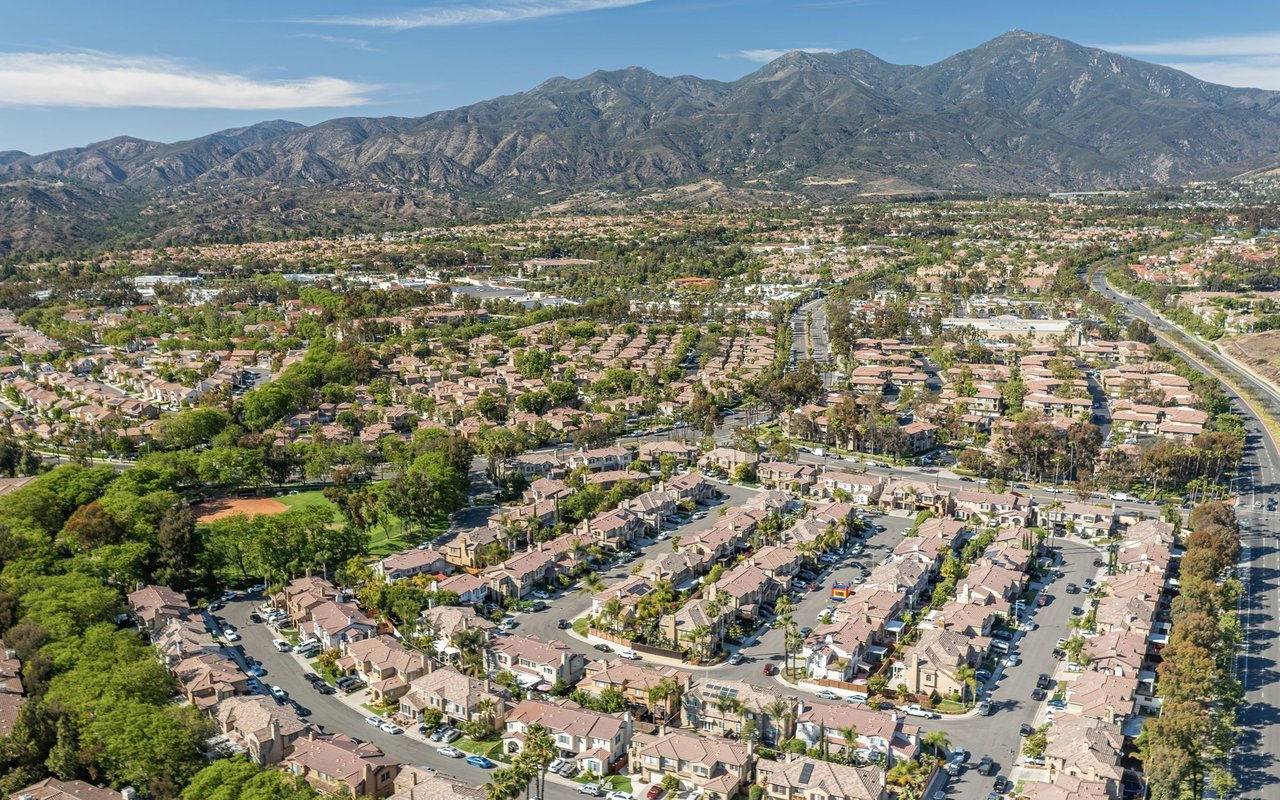
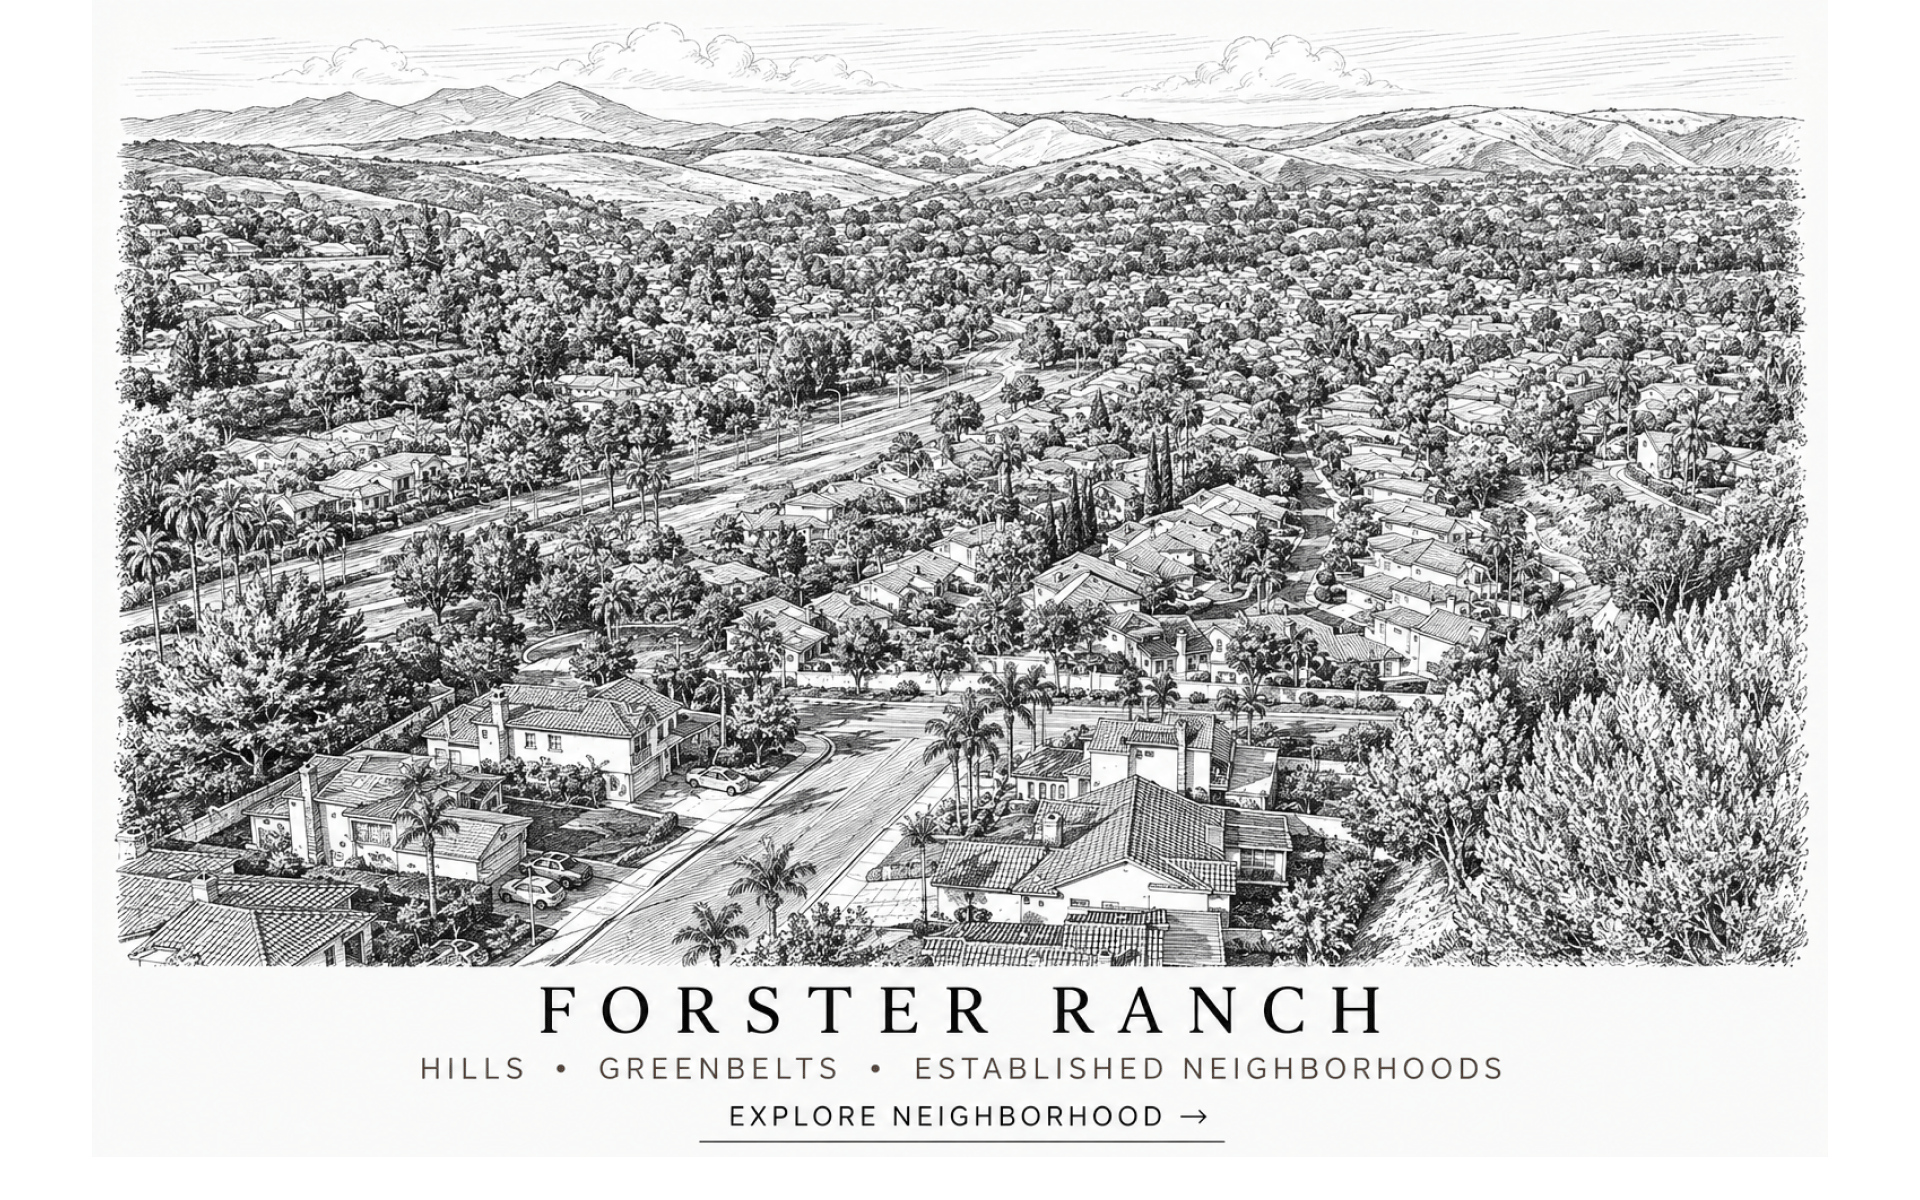
Forster Ranch is one of the places I take buyers when they tell me they want San Clemente, but they do not need their front door to be a short walk from the sand. It sits in the northwestern hills of the city, east of Interstate 5, and offers an established residential setting built around rolling terrain, mature landscaping, cul-de-sacs, parks, schools, trails and a wide range of homes and lot configurations.
What makes Forster Ranch interesting is not simply that the homes can be larger than many beach-close properties. It is that the community changes substantially as you move through it. A one-story home in Tocayo Ridge does not live like a larger property in El Encanto. A house tucked against open space in Glen Ridge Estates can feel completely different from a ridgeline home in one of The Reserves. An attached home in an older pocket is a different product again.
That is why I do not treat Forster Ranch as one real estate market. The neighborhood name gets us into the right part of San Clemente. The tract, street, lot, elevation, floor plan, condition and relationship to open space tell us what we are actually buying or selling.
The City of San Clemente's Forster Ranch Specific Plan covers approximately 1,982 acres in the northwestern portion of the city. The area reaches toward San Juan Capistrano to the north and west, sits beside Talega to the east, and is bordered by other San Clemente planning areas to the south. Major roads that organize daily movement through the community include Camino de los Mares, Camino Vera Cruz, Camino del Rio, Portico del Sur, Portico del Norte and Calle Sarmentoso.
Those roads matter because Forster Ranch is not laid out like coastal San Clemente. Instead of a compact street grid descending toward the ocean, you move through valleys, slopes and ridgelines. Some neighborhoods sit lower and feel protected by surrounding hills. Others climb toward open space and trail corridors. That geography affects privacy, views, afternoon sun, wind, driveway grade, usable yard space and even how long it takes to get in and out of a particular pocket.
If you are still deciding how Forster Ranch fits into the rest of town, start with my San Clemente community guide, which compares the city's major neighborhoods and lifestyles.
The mistake I see buyers make is assuming that 'Forster Ranch' means one style of home on one kind of lot. The City's planning documents alone identify a long list of separate residential areas, and the resale market uses even more familiar tract and neighborhood names.
Depending on where you are searching, you may see names such as Tocayo Ridge, Tocayo Hills, Tocayo Canyon, Glen Ridge Estates, Rimrock, Flora Vista, Sunset Ridge, El Encanto, Las Veredas, Compass Pointe, Cantomar, Del Cabo, Veracruz, Villamar, Casablanca, The Colony, Naples, Alisal and the four gated Reserve communities. Some are detached single-family neighborhoods. Some are detached-condominium or attached communities. Some are older and more established. Some sit higher on the hills. Some offer unusually large homes. Some are valuable because of a flat yard, a quiet cul-de-sac or direct relationship to open space rather than because of size alone.
The practical lesson is simple: do not compare two Forster Ranch homes just because they are close on a map. I want to know whether the same buyer would realistically choose between them.
Tocayo Ridge is one of the established names buyers encounter frequently in Forster Ranch. The neighborhood includes detached homes developed in the 1980s, with a mix of one- and two-story layouts, mature landscaping and lots that can vary considerably in shape and usability.
This is a good example of why the lot matters more than the tract label. One home may sit on a relatively level parcel with a deep backyard and useful side-yard space. Another may occupy a larger recorded lot but lose a meaningful portion of that land to slope. Cul-de-sac positioning, rear-neighbor elevation, privacy and driveway layout can materially change how a home lives.
For buyers specifically looking for a true single-story home, Tocayo Ridge and other established Forster Ranch neighborhoods are worth watching. One-level inventory is not unlimited, so when the right combination of floor plan, street and yard appears, it can attract a very specific buyer pool.
Tocayo Hills and Tocayo Canyon occupy other established portions of the community and illustrate the density differences that exist inside Forster Ranch. City planning documents identify Tocayo Hills as detached single-family housing with substantial open-space acreage woven through portions of the tract, while Tocayo Canyon was planned as a denser detached-condominium product.
That difference matters in real life. A buyer focused on yard depth, privacy and a more conventional detached-home feel may evaluate Tocayo Hills very differently from a buyer who prefers a lower-maintenance ownership model. I also look closely at where the home sits relative to slopes and open space. A rear boundary that opens toward a hillside can feel more private than a home with another residence immediately behind it, but drainage, vegetation, fire-zone requirements and slope maintenance can become part of the due diligence.
Glen Ridge Estates is one of the Forster Ranch pockets I pay close attention to when a buyer wants a traditional detached home, mature surroundings and the possibility of a larger or more functional yard. Homes here date primarily from the 1980s, and the neighborhood has the established look that many buyers specifically prefer over newer master-planned construction.
The best lots can be a major part of the value story. Backyard depth, pool placement, RV access, privacy and the amount of genuinely flat outdoor space can separate two otherwise similar houses. Some properties also have street and driveway configurations that work especially well for multiple vehicles or recreational equipment.
Condition varies. A house may still have a more traditional original layout, while another nearby has been opened up, expanded or extensively renovated. I would not value those two properties by square footage alone. The quality of the remodel, permitted work, systems, roof, windows, drainage and outdoor improvements all belong in the comparison.
Rimrock is another established single-family area in Forster Ranch. The neighborhood's winding streets and hillside setting can create meaningful differences from lot to lot, especially where homes relate to slopes, side yards and neighboring rooflines.
This is where I want buyers to slow down and stand in the backyard. A listing may advertise a large lot, but I want to know what portion is actually level and usable. I also want to look at rear elevation, retaining conditions, afternoon sun and whether neighboring homes sit above, below or directly behind the property. Those details influence privacy far more than the subdivision name.
The City's Forster Ranch plan groups Flora Vista and Sunset Ridge within a large single-family planning area. These neighborhoods are part of the broader established Forster Ranch fabric and can offer the combination many buyers are searching for: residential streets, mature landscaping, conventional detached-home floor plans and access to the community's parks, schools and trail network.
As everywhere in Forster Ranch, I would not assume every lot is alike. Orientation to the hills, cul-de-sac position, side-yard width, slope and the elevation of nearby homes can change both the feel of the yard and the amount of privacy. Buyers considering future expansion, an outdoor kitchen, a pool or simply more lawn should evaluate the actual building envelope and usable space rather than rely on the parcel size alone.
El Encanto occupies a distinctive portion of Forster Ranch with detached single-family homes and meaningful open-space acreage within the original planning area. The combination of larger homes, varied topography and hillside relationships can make this pocket feel more spacious than denser portions of San Clemente.
This is also an area where orientation matters. A home facing or backing a slope can have a very different light pattern, wind exposure and privacy level from another house only a few doors away. When a property has a broader canyon, hillside or distant coastal outlook, I want to see where that view is actually visible from: kitchen, family room, primary bedroom, backyard or only an upstairs window.
Las Veredas, Compass Pointe and Cantomar are additional names buyers often see when searching the larger Forster Ranch area. They should not be treated as interchangeable simply because they share the same 92673 ZIP code and the same broad community label.
These later-era neighborhoods can offer larger floor plans and a more contemporary layout than some of the earlier Forster Ranch tracts. Depending on the exact home, buyers may encounter bonus rooms, larger primary suites, multiple living areas, three-car or tandem-style garage configurations and yards designed around entertaining. Lot orientation still matters just as much as interior square footage.
For me, the important question is not whether one tract is 'better.' It is what problem the buyer is trying to solve. Someone prioritizing a one-story home, RV access and a flat yard may prefer a very different Forster Ranch pocket from someone who wants a larger two-story residence near a ridgeline or open-space corridor.
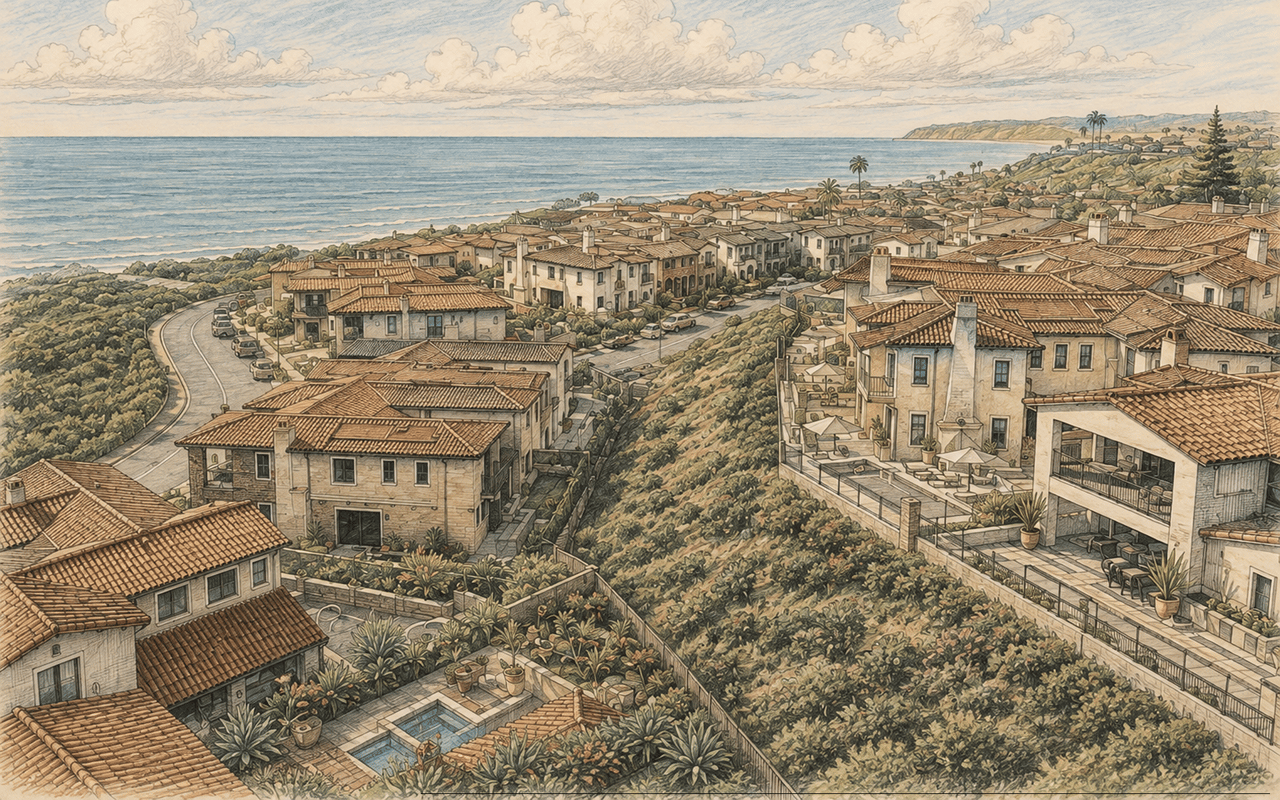
The Reserve is the most prominent gated component of Forster Ranch and consists of four separate enclaves: Reserve North, Reserve South, Reserve East and Reserve West. These communities were developed in the early 2000s, making them newer than much of the surrounding Forster Ranch housing stock.
I would not group all four together for valuation or buyer selection. Their elevations, lot positions, home sizes and view opportunities differ. Some homes have broader canyon, hillside, city-light or distant coastline outlooks; others derive more value from privacy, gated access, newer construction and larger floor plans than from a major view.
The Reserve is also where I become very careful with the phrase 'ocean view.' Upper Forster Ranch ridgelines can look toward the coast, but the width, foreground and daily visibility of that view can vary dramatically. I want to evaluate it from normal living positions and see what sits in front of the home before assigning a premium.
Reserve South generally sits at a different elevation and product scale from some of the upper Reserve streets, while Reserve East, North and West include homes with their own floor-plan and positioning patterns. The four neighborhoods have separate gated entries, and buyers should verify the specific association structure, current dues, amenities, rules and reserve information for the property they are considering.
The point is not to memorize which Reserve name belongs to which gate. The point is to understand that a sale in one Reserve enclave is not automatically an equal comparable for another. I want to know the model, lot position, view, upgrades, yard, privacy and exact competitive set.
Forster Ranch is best known for detached houses, but the community also includes smaller-scale attached and detached-condominium neighborhoods. City planning records identify communities such as Casablanca, The Colony, Del Cabo, Tocayo Canyon and Villamar among the older residential products in the area.
For these properties, I shift the analysis. Unit or home orientation, garage configuration, guest parking, private outdoor space, association maintenance responsibility and HOA dues may matter as much as the interior remodel. Buyers should also review what the association covers, reserve funding, insurance responsibilities and any known upcoming projects.
If a buyer tells me, 'I want a real backyard,' Forster Ranch is one of the first places I look. But I never sort the MLS by lot size and stop there.
A 10,000-square-foot parcel with a large rear slope may give you less everyday outdoor space than an 8,000-square-foot parcel with a broad, level yard. A side yard can create room for RV or boat access. A house pushed toward the front of the parcel may leave a much deeper backyard than a similar home centered on the lot. A pie-shaped cul-de-sac lot can be terrific or awkward depending on where the usable width actually falls.
I look at flat area, yard depth, side-yard width, privacy, slope, retaining walls, drainage, easements, utility locations, pool placement and how the house sits on the parcel. If a buyer wants a pool, outdoor kitchen, play area, garden, dog run or RV parking, I evaluate the property for that exact use.
I go deeper into this subject in my guide to San Clemente neighborhoods with the largest and most usable lots.
One feature that shows up more often in Forster Ranch than in many beach-close parts of San Clemente is potential RV or boat parking. That can be a meaningful advantage, but it is always property-specific.
A wide side yard does not automatically mean an RV is permitted or practical. I want to measure the access, look at gate width, grade, utility equipment, roof eaves and turning radius, and then verify any HOA rules or recorded restrictions. On a property where legitimate RV access already exists, that feature can attract a buyer who would have very few substitutes elsewhere in the city.
Forster Ranch is also relevant for buyers who specifically want one-level living. True single-story detached homes appear in several established pockets, although the supply is limited and can be very uneven.
I pay attention to more than the word 'single-story.' Is the main living area truly step-free? Is the garage at the same level? Are there interior sunken rooms? Is the yard accessible without stairs? Is the driveway steep? A home can technically be one story and still function very differently for someone prioritizing easier daily movement.
The Forster Ranch Ridgeline Trail is one of the area's defining outdoor features. The City describes it as a 3.2-mile natural-surface trail following the crest of the hills along the south and east side of the development, with steep sections, designated viewpoints and broad views across San Clemente's inland neighborhoods toward the ocean.
For real estate, the trail and surrounding open space matter in several ways. A home near a trailhead can make hiking part of the daily routine. A property backing toward open space may feel more private than an interior lot. At the same time, buyers should consider trail activity, vegetation management, slope conditions, wildlife, fire-safety requirements and whether the rear boundary is maintained by an HOA, public agency or the homeowner.
Forster Ranch Community Park at 3207 Camino Vera Cruz is a major neighborhood anchor. City facilities include baseball/softball, multipurpose and soccer fields, a running track and walking loop, children's play area, picnic areas, restrooms and lighted tennis courts.
For some buyers, being able to reach the park quickly is a major convenience. For others, a quieter interior location farther from organized sports activity may matter more. I like to drive the route at the times a buyer expects to use it rather than assume that 'near the park' is automatically positive or negative.
Truman Benedict Elementary and Bernice Ayer Middle School sit next to one another on Calle Sarmentoso, placing two public-school campuses directly within the Forster Ranch area. San Clemente High School serves the broader San Clemente community, subject to current district attendance boundaries and policies.
School proximity changes the daily rhythm of some streets. Morning and afternoon drop-off traffic, pedestrian activity and event schedules can matter to a buyer living close to the campuses. I recommend verifying the assigned school for the exact address directly with Capistrano Unified rather than relying on an MLS field or neighborhood assumption because boundaries and programs can change.
Forster Ranch feels more residential and inland than San Clemente's beach neighborhoods. You are not walking down Avenida Del Mar for coffee or carrying a surfboard to T-Street from most homes here. The tradeoff is space, mature landscaping, quieter residential streets in many pockets, parks, schools, trail access and the possibility of yards and garage configurations that are difficult to reproduce close to the coast.
The inland position also changes the weather. Forster Ranch can clear earlier and feel warmer than the immediate coast when the marine layer is sitting over the beach. Higher and more exposed streets can be breezier. Canyon and slope orientation can affect morning shade and afternoon sun. I encourage buyers to visit the same property at different times of day when these details matter to them.
Camino de los Mares is one of the key routes connecting Forster Ranch toward Interstate 5 and the coastal side of San Clemente. Camino Vera Cruz, Camino del Rio, Portico del Norte, Portico del Sur and the neighborhood street network then distribute traffic into the individual tracts.
The important thing for a buyer is that 'Forster Ranch' does not have one commute. A home near an outer access point can have a very different morning routine from a property deeper into the hills. If commute time matters, I recommend driving the actual route during the hour you expect to use it.
Forster Ranch is inland and should not be marketed as a walk-to-the-beach neighborhood. That is part of the decision, not a flaw to hide. If daily sand-and-surf access is the top priority, I would start in Southwest, Central, the Pier Bowl, North Beach or another coastal pocket.
Forster Ranch makes more sense for the buyer who is willing to drive to the coast in exchange for an established neighborhood, larger-home possibilities, mature landscaping, parks, schools, trail access and, in many cases, more functional outdoor space.
If you are comparing that tradeoff directly, my Talega vs. Forster Ranch guide is designed for exactly that decision.
Forster Ranch and Talega are both inland San Clemente communities, but I would never present them as interchangeable. Forster Ranch is older and more established overall, with mature landscaping, a broad range of construction eras and many streets where the lot itself is a major part of the appeal. Talega is a larger master-planned community with a more extensive shared-amenity structure, multiple pools, a golf course and dozens of distinct neighborhoods developed primarily later.
If you want the community amenities and newer master-planned environment, Talega may rise on the list. If you want mature trees, established streets, the possibility of a larger or more individual lot and a less resort-style community structure, Forster Ranch may fit better. The right answer depends on the exact home and the way you want to live.
You can explore the other side of that comparison in my Talega San Clemente guide.
The Coast District, Rancho San Clemente and Forster Ranch are all east-of-freeway or hillside-oriented areas that buyers sometimes compare, but they solve different priorities. Coast District is more closely associated with established hillside streets and ocean-view corridors. Rancho San Clemente has dramatic ridgeline and canyon topography in several tracts. Forster Ranch often wins the conversation when the priority is mature landscaping, established residential streets, schools and parks within the community, and the possibility of a larger usable yard.
I would compare actual properties rather than neighborhood reputations. A flat Forster Ranch cul-de-sac lot may be a better fit for one buyer than a more dramatic view lot elsewhere. Another buyer may gladly trade yard space for the view.
Association structure is not uniform across Forster Ranch. Some homes are part of a master or tract association; gated and attached communities can have additional or different obligations. The Reserve enclaves, for example, should be reviewed separately from an older non-gated tract.
I would verify current dues, what the association maintains, architectural rules, parking and RV restrictions, insurance responsibilities, reserve funding and any known or planned assessments for the exact property. Online HOA numbers can become outdated quickly, and a buyer should understand the complete recurring cost before writing an offer.
Forster Ranch includes multiple development periods, so I do not use one blanket property-tax or special-assessment estimate for the entire area. The best practice is to review the current tax bill and disclosures for the specific parcel.
That is especially important when comparing an older Forster Ranch home with a newer home in The Reserve or with a property in Talega. Purchase price is only one part of the monthly ownership cost. HOA dues, insurance, taxes and any property-specific assessments need to be considered together.
Much of Forster Ranch was built during the 1980s and 1990s, with later construction extending into the early 2000s. That means condition can vary enormously. One home may still have original windows, plumbing fixtures, roof components and compartmentalized interior spaces. Another may have been comprehensively renovated and reconfigured.
When I tour an older Forster Ranch home, I look beyond the finishes. I want to understand roof age, HVAC, electrical changes, plumbing, windows, drainage, retaining walls, exterior wood, additions, removed walls, garage conversions and whether major alterations were permitted. On hillside or slope-adjacent lots, drainage and retaining conditions deserve particular attention.
My broader checklist is in Buying an Older Home in San Clemente.
This is where the new benchmark matters most. Two homes can share the same tract name, similar square footage and the same number of bedrooms and still have very different market appeal.
A flat private backyard can matter. A true cul-de-sac can matter. RV access can matter. A three-car garage can matter. A one-story floor plan can matter. Backing to open space can matter. A premium ridgeline view can matter. A rear slope that reduces usable yard can matter. A beautifully executed remodel can matter. So can the quality of the street, driveway grade and the elevation of the neighbors behind you.
I do not average those differences away with a generic price-per-square-foot number. I want the most relevant tract and floor-plan comparables I can find, and then I adjust for the things buyers will actually feel when they stand at the property.
For sellers, I explain that process in What Is My San Clemente Home Worth?.
Before writing an offer, I would drive the exact street more than once. I would look at where the neighborhood sits in relation to Camino de los Mares and Camino Vera Cruz. I would stand in the backyard and look at the slope, privacy and afternoon exposure. I would measure whether the 'RV access' actually works. I would check the garage with the kind of vehicles you own in mind. I would listen for road, school, park and neighborhood activity. I would inspect retaining and drainage conditions and verify the complete HOA and tax picture.
Most importantly, I would decide what you are paying for. Is the premium coming from a flat yard? A larger home? Gated Reserve positioning? A one-story layout? Open-space backing? A remodeled interior? A rare street? If we cannot clearly explain the premium, I want to be cautious about paying it.
For the broader property-level checklist I use throughout the city, see What Should I Look for During a San Clemente Home Tour?.
Forster Ranch sellers are competing against more than the home down the street. A buyer at the same price point may also be looking at Talega, Rancho San Clemente, Coast District, Marblehead or a smaller home closer to the beach. Good marketing has to make the reason to choose this property obvious.
If the home has a genuinely exceptional yard, show the usable area clearly. If it has RV access, document the functionality rather than hiding it in a feature list. If the lot backs to open space, photograph that relationship. If the home is single-story, make that easy to understand. If the view is a meaningful part of the value, show where it is experienced from. If a remodel was extensive and permitted, tell that story.
Generic 'beautiful Forster Ranch home' copy is not enough. The strongest listing explains why this exact house, on this exact lot, on this exact street, is difficult to reproduce.
Forster Ranch is especially worth exploring if you want San Clemente but place more value on established residential streets, mature landscaping, parks, trails, schools, a garage and driveway that function well, and the possibility of more usable outdoor space than you may find near the beach.
It is not the first place I would send a buyer whose number-one goal is to walk to the sand, downtown restaurants or the Pier. It also is not one uniform answer for someone who says they want a 'big lot.' The community is too varied for that.
The right approach is to choose the Forster Ranch micro-market that solves your priorities, then choose the street, lot and house within it.
If you are still narrowing the city, my Where Should I Live in San Clemente? neighborhood guide is a useful next step.
Forster Ranch is in the northwestern inland portion of San Clemente, primarily east of Interstate 5. The City's Forster Ranch Specific Plan covers about 1,982 acres and includes major access streets such as Camino de los Mares, Camino Vera Cruz, Camino del Rio, Portico del Norte and Portico del Sur.
Commonly referenced neighborhoods include Tocayo Ridge, Tocayo Hills, Tocayo Canyon, Glen Ridge Estates, Rimrock, Flora Vista, Sunset Ridge, El Encanto, Las Veredas, Compass Pointe, Cantomar, Del Cabo, Veracruz, Villamar and several attached or detached-condominium communities. The gated Reserve area includes Reserve North, Reserve South, Reserve East and Reserve West. Exact real-estate naming can vary by source, so I verify the subdivision for the specific property.
Many Forster Ranch homes have larger parcels than buyers commonly see in denser coastal San Clemente, but the recorded lot size does not tell the entire story. Slope, retaining walls, easements and home placement can reduce usable yard area. I compare functional outdoor space, not just the assessor's square footage.
Yes, some Forster Ranch properties have side-yard configurations or existing improvements that can accommodate RV or boat parking. It is property-specific, and buyers should verify physical access plus HOA and recorded restrictions before assuming it is permitted.
Yes. Several established Forster Ranch pockets include true one-story detached homes, although inventory can be limited. Buyers who specifically want one-level living should also check garage access, interior steps, driveway grade and backyard accessibility.
The Reserve is a gated early-2000s collection consisting of Reserve North, Reserve South, Reserve East and Reserve West. The four enclaves have separate gates and should be evaluated independently for floor plans, lot position, views, HOA structure and pricing.
Select elevated or ridgeline properties can have distant ocean, coastline or broad western views, while many homes have hill, canyon, open-space or neighborhood outlooks. I would never assume a view from the tract name alone. The exact lot and orientation determine what you see.
Yes. The City-operated Forster Ranch Ridgeline Trail follows the hills along the south and east side of the community for about 3.2 miles and includes steep sections and designated viewpoints. Access convenience varies by neighborhood and street.
Forster Ranch Community Park on Camino Vera Cruz is a major local facility with sports fields, a running/walking loop, play areas, picnic facilities and lighted tennis courts. Additional parks and recreation areas are accessible in surrounding north San Clemente.
Truman Benedict Elementary and Bernice Ayer Middle School are located on Calle Sarmentoso within the Forster Ranch area. School assignments and programs should always be verified with Capistrano Unified using the exact property address.
Many Forster Ranch properties are associated with a master or tract HOA, and gated or attached communities may have different or additional association obligations. Dues and coverage vary, so I verify the current documents for the specific home rather than quoting one community-wide number.
Do not assume one answer applies to every Forster Ranch property. The area was developed over multiple periods and includes different tracts. Review the current property tax bill and any special assessments for the exact parcel before making a purchase decision.
For most residents, no. Forster Ranch is inland and the beach is generally a drive rather than an everyday walk. Buyers usually choose it for the residential setting, parks, trails, home and lot options rather than immediate beach access.
Forster Ranch generally feels older, more established and more mature in its landscaping, with many 1980s- and 1990s-era neighborhoods and a strong emphasis on the individual lot. Talega was developed later as a much larger master-planned community with a broader shared-amenity structure. Buyers should experience both because the day-to-day feel is different.
I would focus on the exact tract, street, usable yard, slope, privacy, open-space relationship, driveway and garage function, RV access if relevant, remodel quality, drainage, HOA obligations and the real route in and out of the neighborhood. Those details often matter more than the broad Forster Ranch label.
Forster Ranch is one of San Clemente's most useful neighborhoods to understand because it offers a version of the city that buyers do not always expect when they first picture a beach town. It is established, green, hilly and residential, with enough variety that a buyer can move only a few streets and change the home style, lot, privacy and daily routine considerably.
After working in Orange County real estate since 1989, I have learned that the best neighborhood advice is rarely 'buy here.' It is understanding why one property fits your priorities better than another.
In Forster Ranch, that means looking past the listing photos and asking better questions: How much of the yard is actually usable? What is behind the property? Is the driveway easy? Is the street quiet? How does the sun hit the backyard? Is the view real from the rooms you use? What does the HOA cover? What was remodeled? What still needs work? And how does this tract compare with the other Forster Ranch options a buyer will see at the same price?
Those are the details that help a buyer choose well and help a seller position a home correctly.
Tom Bertog
Tom Bertog Real Estate | San Clemente, CA
Serving Orange County since 1989
13,512 people live in Forster Ranch , where the median age is 53 and the average individual income is $75,598. Data provided by the U.S. Census Bureau.
Total Population
Median Age
Population Density
Average individual Income
There's plenty to do around Forster Ranch , including shopping, dining, nightlife, parks, and more. Data provided by Walk Score and Yelp.
Explore popular things to do in the area, including Anju Jain, Todd Kline, and Ridgeline Trail-Camino Del Rio Trailhead.
| Name | Category | Distance | Reviews |
Ratings by
Yelp
|
|---|---|---|---|---|
| Active | 0.33 miles | 1 review | 5/5 stars | |
| Active | 0.33 miles | 2 reviews | 5/5 stars | |
| Active | 0.85 miles | 0 reviews | 0/5 stars | |
| Active | 0.85 miles | 9 reviews | 5/5 stars | |
| Active | 0.85 miles | 0 reviews | 0/5 stars | |
| Active | 0.85 miles | 0 reviews | 0/5 stars | |
| Active | 1.26 miles | 0 reviews | 0/5 stars | |
| Beauty | 0.33 miles | 0 reviews | 0/5 stars | |
| Beauty | 0.85 miles | 0 reviews | 0/5 stars | |
| Beauty | 0.85 miles | 2 reviews | 5/5 stars | |
| Beauty | 0.85 miles | 0 reviews | 0/5 stars | |
|
|
||||
|
|
||||
|
|
||||
|
|
||||
|
|
||||
|
|
Forster Ranch has 4,413 households, with an average household size of 3. Data provided by the U.S. Census Bureau. Here’s what the people living in Forster Ranch do for work — and how long it takes them to get there. Data provided by the U.S. Census Bureau. 13,512 people call Forster Ranch home. The population density is 4,210 and the largest age group is Data provided by the U.S. Census Bureau.
Total Population
Population Density Population Density This is the number of people per square mile in a neighborhood.
Median Age
Men vs Women
Population by Age Group
0-9 Years
10-17 Years
18-24 Years
25-64 Years
65-74 Years
75+ Years
Education Level
Total Households
Average Household Size
Average individual Income
Households with Children
With Children:
Without Children:
Blue vs White Collar Workers
Blue Collar:
White Collar: